I’ve spent my fair share of time wrestling with terminal commands to monitor Linux systems, trying to piece together performance data from tools like top or vmstat. But what I really wanted was a simpler way to track critical stats remotely, without the complexity of heavy dashboards or the clutter of raw outputs. That’s why I created SysMonitor, an open-source UI tool to help users like me — and many of you — monitor Linux systems more effectively. It’s not a perfect tool by a long shot, but it’s my attempt to address a need I know many of us share: clear, accessible system monitoring without the hassle.
What SysMonitor Does
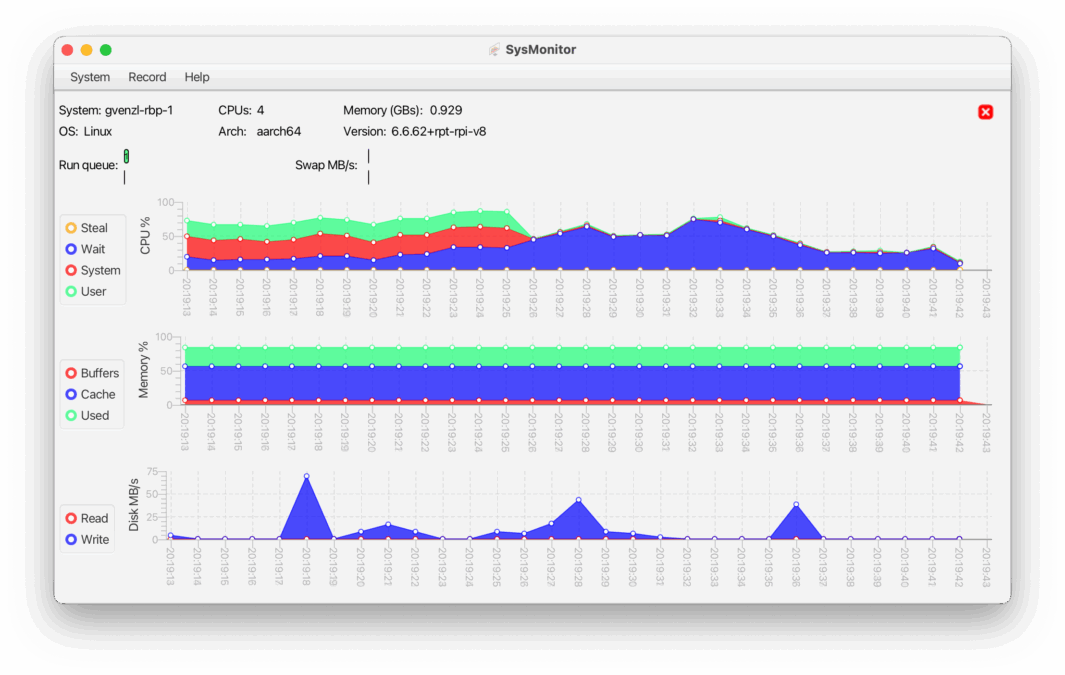
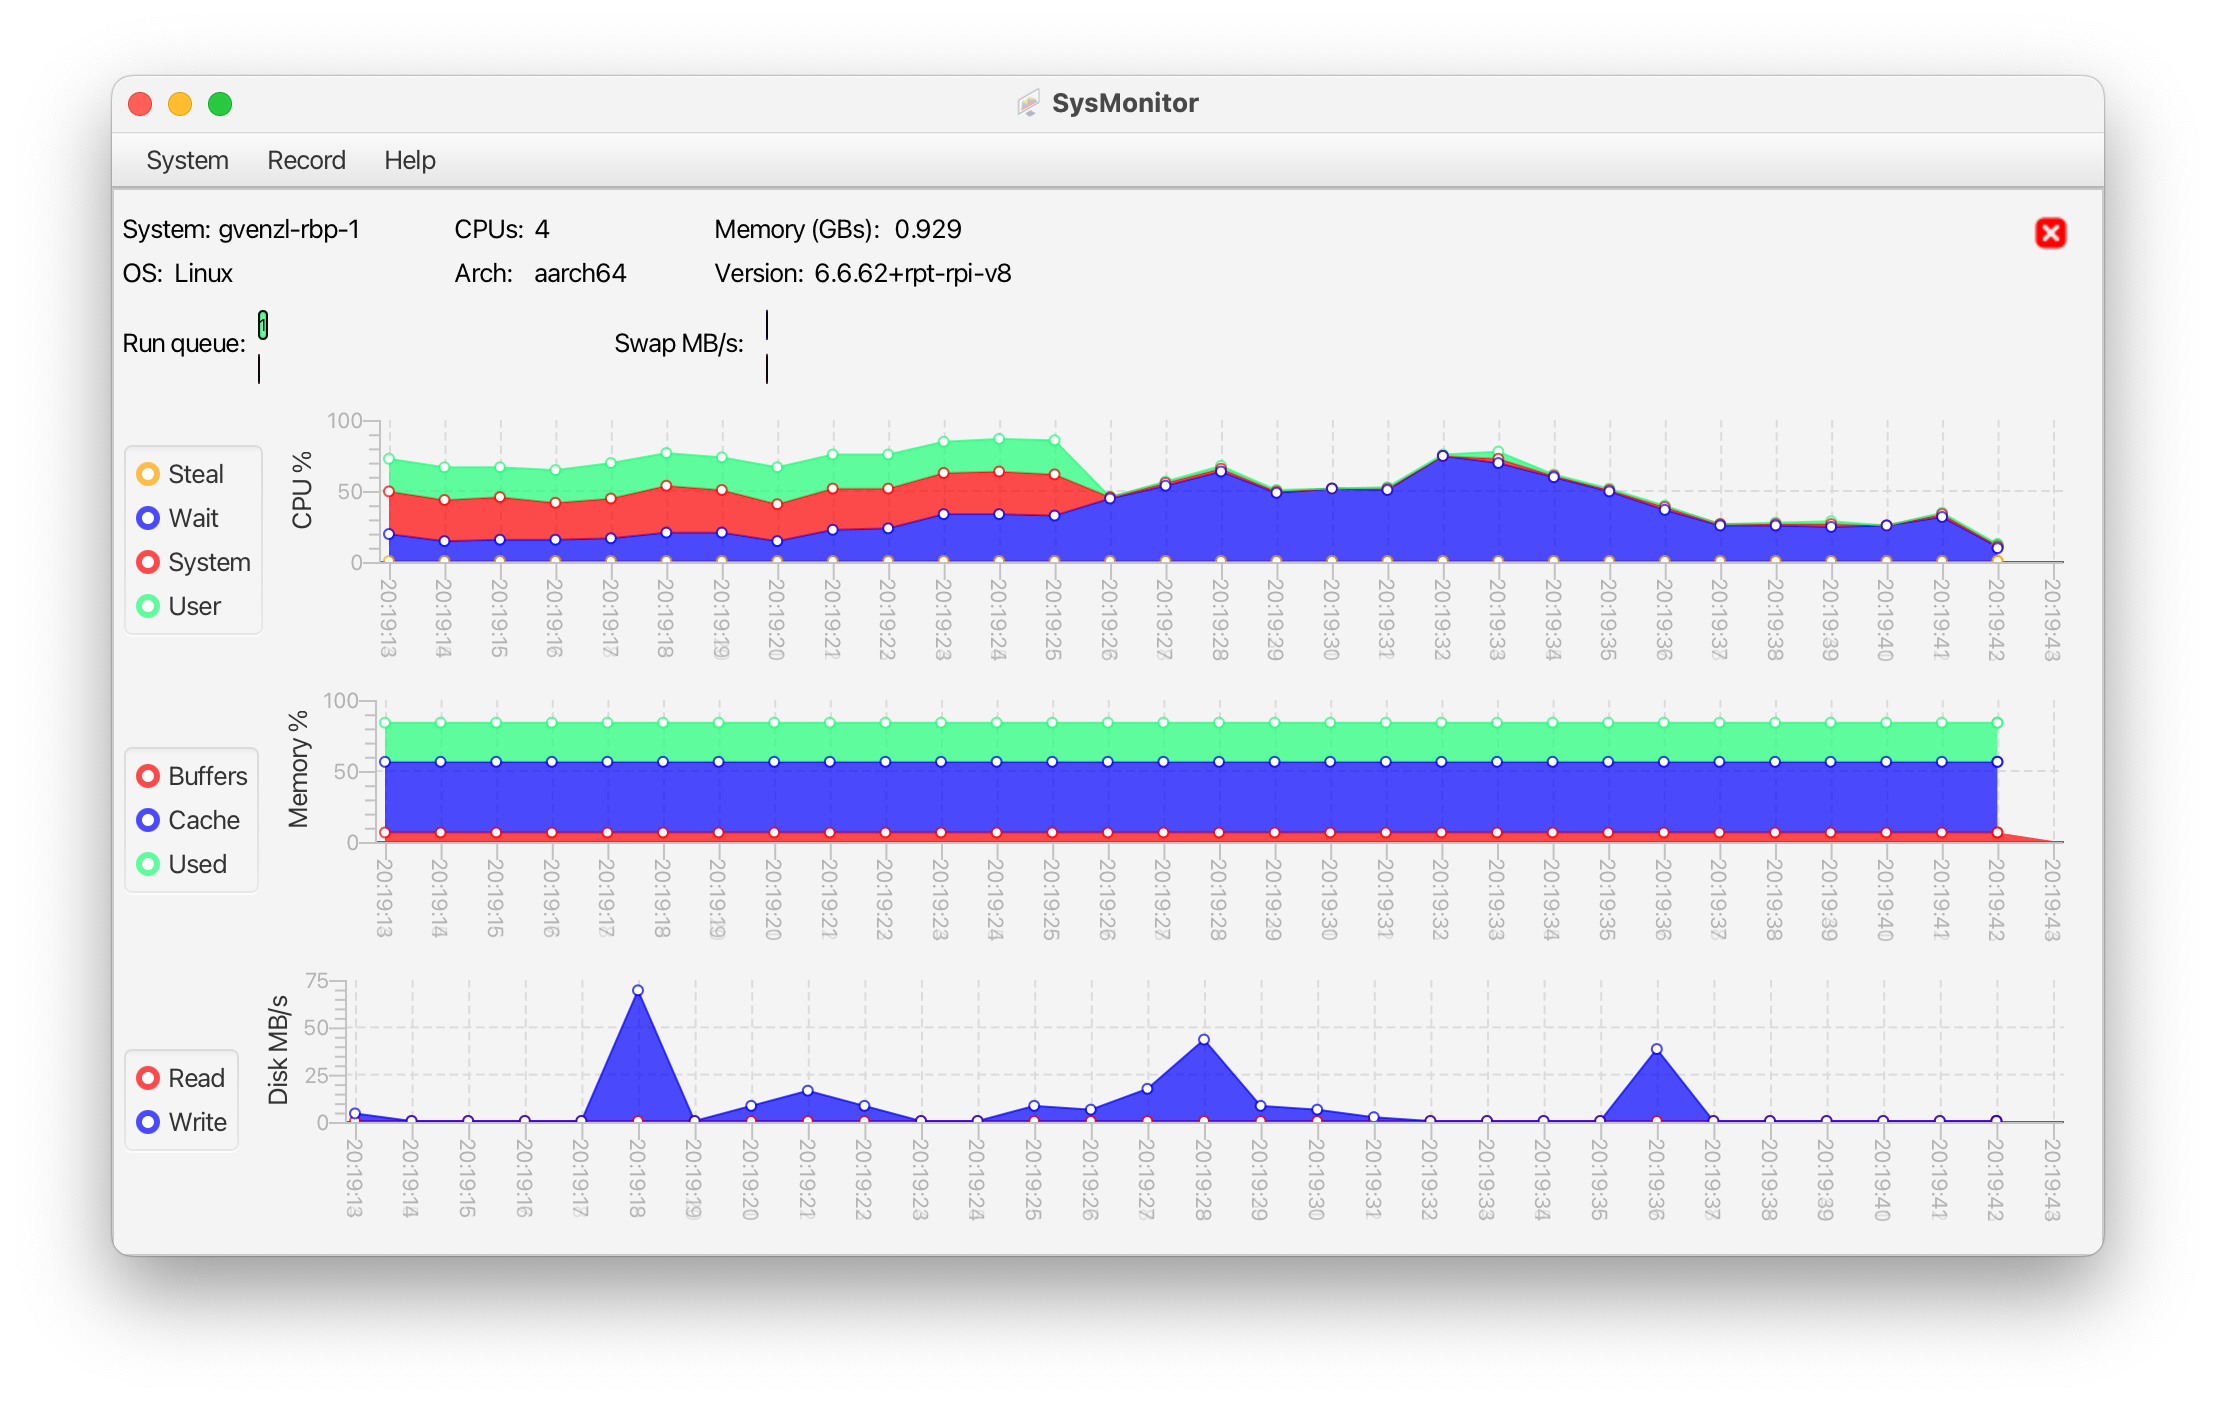
SysMonitor provides a straightforward interface to view both dynamic and static information about remote Linux systems. It tracks:
- Real-Time Performance Metrics:
- CPU usage: Identify high loads or spikes to troubleshoot performance.
- Memory usage: Monitor available RAM to catch memory hogs or memory pressure.
- Disk usage: Keep an eye on I/O throughput.
- Run queue: Gauge system load and process demands.
- Block queue: Detect I/O bottlenecks in disk operations.
- Swap read/write: Spot excessive swapping that slows systems down.
- Static System Information:
- Hostname: Confirm which system you’re monitoring.
- CPU core count: Understand available processing power.
- Total memory: Know the system’s memory capacity.
- OS info: Check the OS, version, and architecture for debugging or compatibility.
With all these metrics displayed in a single, visual dashboard, SysMonitor helps you quickly assess system health, diagnose issues, and optimize performance.
How It Helps You
SysMonitor was born out of my own struggles with monitoring Linux servers, and it’s designed to help others facing similar challenges. It’s not flawless — there are edge cases to iron out and features to add — but it’s a practical tool for real-world tasks. Here’s what you can accomplish with it:
- Troubleshoot Performance Problems: See at a glance if CPU, memory, or disk I/O is causing slowdowns. For instance, a high run queue or swap activity can point to resource issues, helping you tweak configurations or kill problematic processes.
- Avoid Downtime: Track disk I/O to catch I/O waits early, or monitor memory to prevent crashes from runaway processes.
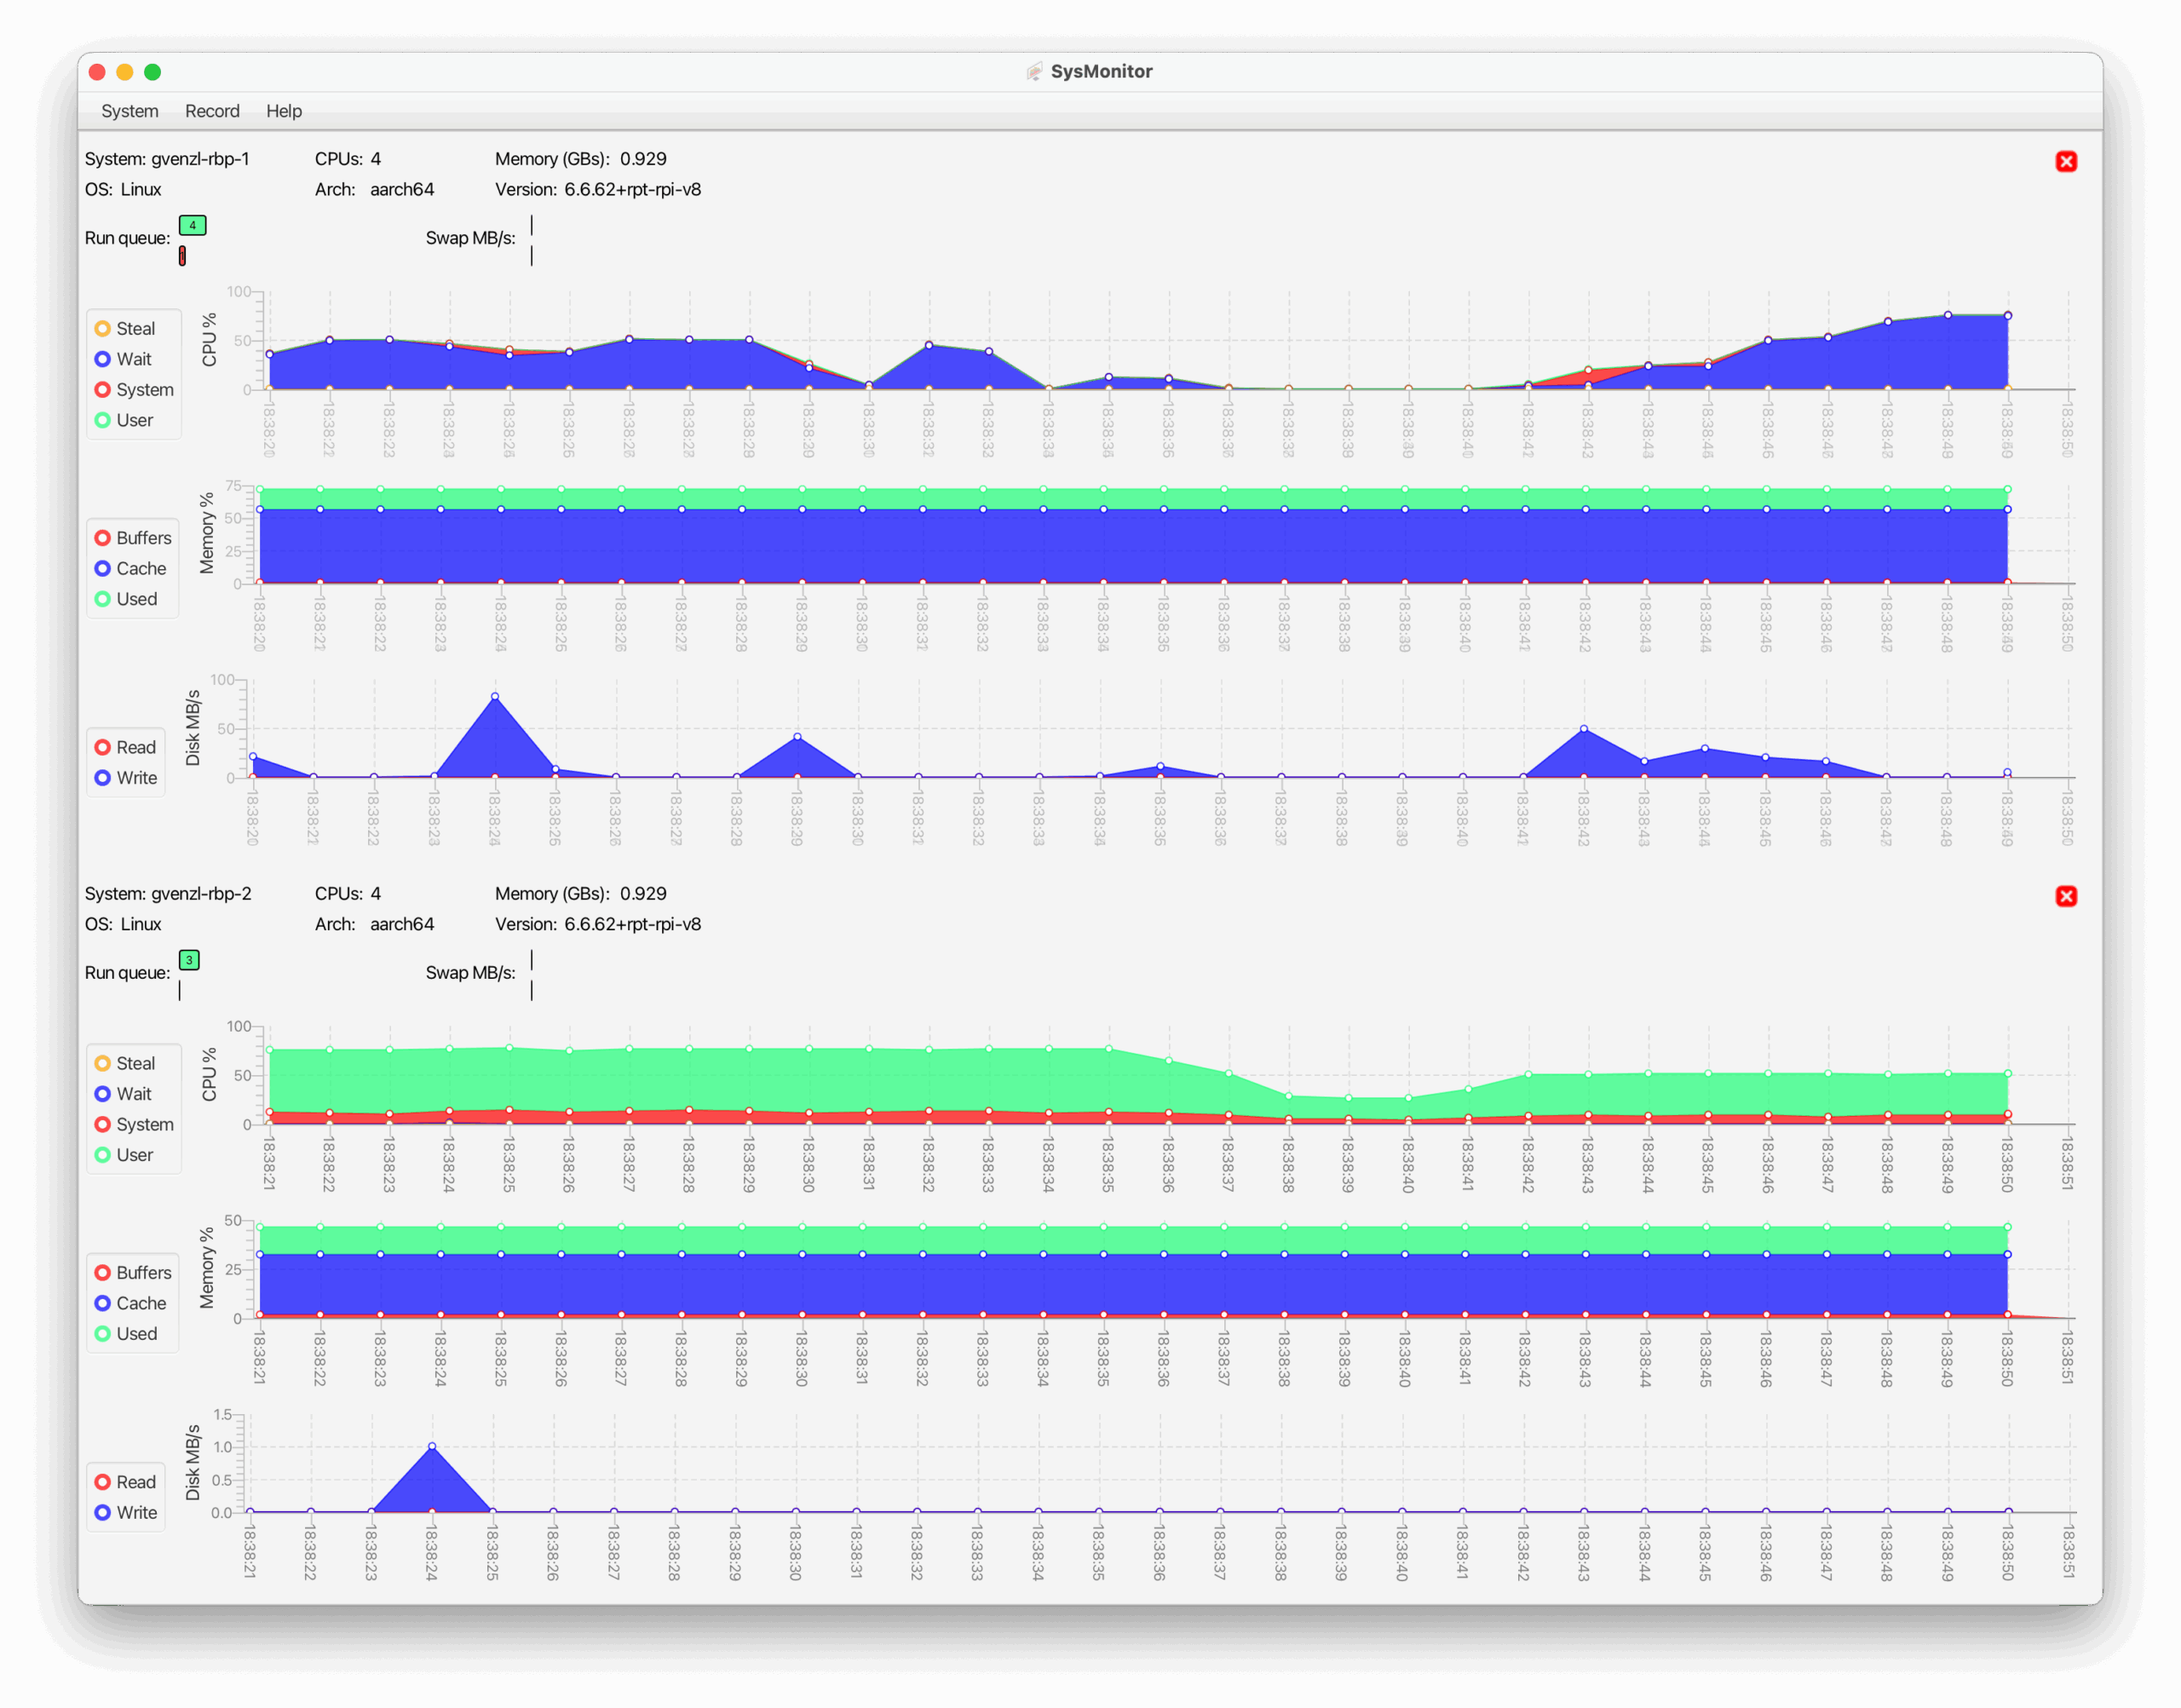
- Monitor Multiple Systems: Use SSH to connect to remote servers and check multiple machines from one interface, saving time for sysadmins managing many machines.
- Understand System Behavior: The visual dashboard makes it easier for learners or hobbyists to see how Linux responds to workloads, clarifying concepts like process scheduling or memory management.
- Document Configurations: Static details like hostname and kernel version, paired with exportable metrics, help you record system setups for audits or team collaboration.
Unlike command-line tools that require parsing text or web-based dashboards that demand complex setups, SysMonitor strikes a balance: it’s lightweight, graphical, and easy to use. It’s my attempt to make monitoring less painful for those of us who’ve felt the same frustration with existing tools.
How to Use It
- Install: Download and install from https://github.com/gvenzl/sysmonitor/releases for your system. A fair warning, I was only able to test it on Mac OS X x86 and arm64. It’s built with no external dependencies to work on most machines.
- Connect: Connect via SSH to your target system(s) via a UI prompt or config file.
- Monitor: Launch
SysMonitorto see a dashboard of real-time stats and static info. Customize refresh rates or record the readings into a file. - Extend: As an open-source project, you can tweak the code to add features or fix issues that matter to you.
The tool uses OpenJDK, JavaFX, and a Java-based SSH client for remote data collection, keeping it lightweight and compatible with a wide range of systems.
Who It’s For
- Sysadmins: Check server health quickly to resolve issues before they escalate.
- Developers: Monitor test environments to ensure smooth application performance.
- Educators and Students: Explore Linux internals with a visual, beginner-friendly tool.
- Hobbyists: Track personal projects like home servers or Raspberry Pis without complex setups.
A Work in Progress
I built SysMonitor to scratch my own itch, but I know it’s not perfect. There are likely bugs to squash and features I haven’t considered, and it’s my first attempt at JavaFX. That’s why it’s open source under the Apache License, Version 2.0, so that the community can help shape it into something even more useful. If you’ve ever struggled with Linux monitoring and wished for a simpler solution, this tool is for you.
Get Started
If you’ve ever felt overwhelmed by Linux monitoring tools, I invite you to try SysMonitor. It’s my attempt to make things easier, and I hope it helps you as much as it’s helped me. Download it from https://github.com/gvenzl/sysmonitor, where you’ll find the installation files and documentation to get started in minutes. Feel free to let me know what works, what doesn’t, and how we can improve it together.
Happy monitoring!
Nice tool.
I notice that the connections are not stored on Mac ARM.
Hm, I need to double check that, it works on my ARM Mac.
Can it be that it worn’t allow writing to $HOME/.sysmonitor on yours?
The .sysmonitor directory was missing.
After manually creating it, the config.xml was created indeed.
Thanks!
Hm, it should have created it itself.
I will check on that!
Thanks,