Recently, I blogged about how you can run Oracle Database Free on a Raspberry Pi 5. However, if you try to do the same thing on a Raspberry Pi 4 or older, you will run into this strange error:
gvenzl@gvenzl-rbp-4:~ $ grep "Model" /proc/cpuinfo
Model		: Raspberry Pi 4 Model B Rev 1.5
gvenzl@gvenzl-rbp-4:~ $ podman run --name test -e ORACLE_PASSWORD=foo gvenzl/oracle-free:slim
CONTAINER: starting up...
CONTAINER: first database startup, initializing...
CONTAINER: uncompressing database data files, please wait...
CONTAINER: done uncompressing database data files, duration: 86 seconds.
CONTAINER: starting up Oracle Database...

LSNRCTL for Linux: Version 23.0.0.0.0 - Production on 22-SEP-2024 03:00:45

Copyright (c) 1991, 2024, Oracle.  All rights reserved.

Starting /opt/oracle/product/23ai/dbhomeFree/bin/tnslsnr: please wait...

TNS-12547: TNS:lost contact
 TNS-12560: Database communication protocol error.
  TNS-00517: Lost contact
   Linux Error: 32: Broken pipe

############################################
DATABASE STARTUP FAILED!
CHECK LOG OUTPUT ABOVE FOR MORE INFORMATION!
############################################
gvenzl@gvenzl-rbp-4:~ $
What’s going on? Well, let’s take a closer look.
Crashing processes
Savvy Oracle Database users will have already noticed that it is the Listener command line utility lsnrctl that reports the error. A TNS-00517: Lost contact is documented as Cause: Partner has unexpectedly gone away. Action: Investigate partner application for abnormal termination. In this particular case, the “partner” application is the Listener process itself:
[oracle@3e8fb8b8ee97 ~]$ lsnrctl start

LSNRCTL for Linux: Version 23.0.0.0.0 - Production on 22-SEP-2024 03:07:04

Copyright (c) 1991, 2024, Oracle.  All rights reserved.

Starting /opt/oracle/product/23ai/dbhomeFree/bin/tnslsnr: please wait...

TNS-12547: TNS:lost contact
 TNS-12560: Database communication protocol error.
  TNS-00517: Lost contact
   Linux Error: 32: Broken pipe
However, don’t fall into that red herring trap, when starting the database without the Listener, a similar issue can be observed:
[oracle@3e8fb8b8ee97 ~]$ sqlplus / as sysdba

SQL*Plus: Release 23.0.0.0.0 - Production on Sun Sep 22 03:07:59 2024
Version 23.5.0.24.07

Copyright (c) 1982, 2024, Oracle.  All rights reserved.

Connected to an idle instance.

SQL> startup;
ORA-03113: end-of-file on communication channel
Oddly enough, when trying to look into the alert.log, it’s nowhere to be found. All that can be found is a trace file, but even that is empty:
[oracle@3e8fb8b8ee97 ~]$ cd /opt/oracle/diag/rdbms/free/FREE/trace/
[oracle@3e8fb8b8ee97 trace]$ ls -alh
total 8.0K
drwxr-x---  2 oracle oinstall 4.0K Sep 22 03:08 .
drwxr-x--- 16 oracle oinstall 4.0K Sep 21 19:22 ..
-rw-r-----  1 oracle oinstall    0 Sep 22 03:08 FREE_ora_215.trc
[oracle@3e8fb8b8ee97 trace]$ cat FREE_ora_215.trc
[oracle@3e8fb8b8ee97 trace]$
Crashing processes, no log files, just what is going on?
strace to the rescue
Using strace, we can peek into the processes and see what is happening.
[oracle@3e8fb8b8ee97 trace]$ strace -fft -o oracle.strace sqlplus / as sysdba <<EOF
startup;
EOF


SQL*Plus: Release 23.0.0.0.0 - Production on Sun Sep 22 03:12:59 2024
Version 23.5.0.24.07

Copyright (c) 1982, 2024, Oracle.  All rights reserved.

Connected to an idle instance.

SQL> ORA-03113: end-of-file on communication channel
SQL> Disconnected
[oracle@3e8fb8b8ee97 trace]$ ls -alh
total 304K
drwxr-x---  2 oracle oinstall 4.0K Sep 22 03:49 .
drwxr-x--- 16 oracle oinstall 4.0K Sep 21 19:22 ..
-rw-r-----  1 oracle oinstall    0 Sep 22 03:30 FREE_ora_472.trc
-rw-r-----  1 oracle oinstall    0 Sep 22 03:49 FREE_ora_676.trc
-rw-r--r--  1 oracle oinstall  65K Sep 22 03:49 oracle.strace.675
-rw-r--r--  1 oracle oinstall 156K Sep 22 03:49 oracle.strace.676
-rw-r--r--  1 oracle oinstall 1.1K Sep 22 03:49 oracle.strace.677
-rw-r--r--  1 oracle oinstall  65K Sep 22 03:49 oracle.strace.678
[oracle@3e8fb8b8ee97 trace]$ grep "\-\-\-" oracle.strace.67*
oracle.strace.675:03:49:30 --- SIGCHLD {si_signo=SIGCHLD, si_code=CLD_EXITED, si_pid=676, si_uid=54321, si_status=0, si_utime=64, si_stime=6} ---
oracle.strace.676:03:49:29 --- SIGILL {si_signo=SIGILL, si_code=ILL_ILLOPC, si_addr=0xeb532fc} ---
oracle.strace.676:03:49:29 --- SIGILL {si_signo=SIGILL, si_code=ILL_ILLOPC, si_addr=0xeb532fc} ---
oracle.strace.676:03:49:29 --- SIGILL {si_signo=SIGILL, si_code=ILL_ILLOPC, si_addr=0xeb532fc} ---
oracle.strace.676:03:49:29 --- SIGILL {si_signo=SIGILL, si_code=ILL_ILLOPC, si_addr=0xeb532fc} ---
oracle.strace.676:03:49:29 --- SIGILL {si_signo=SIGILL, si_code=ILL_ILLOPC, si_addr=0xeb532fc} ---
oracle.strace.676:03:49:29 --- SIGILL {si_signo=SIGILL, si_code=ILL_ILLOPC, si_addr=0xeb532fc} ---
oracle.strace.676:03:49:29 write(8, "\n\n----- Call Stack Trace -----\n", 31) = 31
oracle.strace.676:03:49:29 write(8, "-------------------- -------- --"..., 80) = 80
oracle.strace.676:03:49:29 write(8, "--------------------- Binary Sta"..., 62) = 62
oracle.strace.676:03:49:29 --- SIGSEGV {si_signo=SIGSEGV, si_code=SEGV_MAPERR, si_addr=0x3} ---
oracle.strace.676:03:49:29 --- SIGSEGV {si_signo=SIGSEGV, si_code=SEGV_MAPERR, si_addr=0x1} ---
oracle.strace.676:03:49:30 --- SIGCHLD {si_signo=SIGCHLD, si_code=CLD_DUMPED, si_pid=677, si_uid=54321, si_status=SIGABRT, si_utime=0, si_stime=4} ---
oracle.strace.677:03:49:29 --- SIGABRT {si_signo=SIGABRT, si_code=SI_TKILL, si_pid=677, si_uid=54321} ---
Very interesting, we see a couple of SIGILL with code ILL_ILLOPC. According to https://www.man7.org/linux/man-pages/man2/sigaction.2.html, that indicates an illegal opcode, or in other words, CPU instruction:
The following values can be placed in si_code for a SIGILLsigaction(2) — Linux manual page
signal:
ILL_ILLOPC
Illegal opcode.
ILL_ILLOPN
Illegal operand.
ILL_ILLADR
Illegal addressing mode.
ILL_ILLTRP
Illegal trap.
ILL_PRVOPC
Privileged opcode.
ILL_PRVREG
Privileged register.
ILL_COPROC
Coprocessor error.
ILL_BADSTK
Internal stack error.
An even closer look at the trace file oracle.strace.676 shows that these errors all happen during file operations on an Oracle Database trace file:
03:49:29 openat(AT_FDCWD, "/opt/oracle/diag/rdbms/free/FREE/metadata/ADR_INTERNAL.mif", O_RDWR|O_DIRECT) = 4
03:49:29 fcntl(4, F_SETFD, FD_CLOEXEC)  = 0
03:49:29 prlimit64(0, RLIMIT_NOFILE, NULL, {rlim_cur=1024*1024, rlim_max=1024*1024}) = 0
03:49:29 fcntl(4, F_DUPFD, 256)         = 256
03:49:29 fcntl(256, F_SETFD, FD_CLOEXEC) = 0
03:49:29 close(4)                       = 0
03:49:29 --- SIGILL {si_signo=SIGILL, si_code=ILL_ILLOPC, si_addr=0xeb532fc} ---
03:49:29 rt_sigprocmask(SIG_BLOCK, [ALRM], NULL, 8) = 0
03:49:29 rt_sigprocmask(SIG_UNBLOCK, [ILL], NULL, 8) = 0
03:49:29 newfstatat(AT_FDCWD, "/opt/oracle/diag/rdbms/free/FREE/trace/FREE_ora_676.trc", 0x7f9daee680, AT_SYMLINK_NOFOLLOW) = -1 ENOENT (No such file or directory)
03:49:29 openat(AT_FDCWD, "/opt/oracle/diag/rdbms/free/FREE/trace/FREE_ora_676.trc", O_WRONLY|O_CREAT|O_APPEND, 0660) = 4
03:49:29 newfstatat(AT_FDCWD, "/opt/oracle/diag/rdbms/free/FREE/trace/FREE_ora_676.trc", {st_mode=S_IFREG|0640, st_size=0, ...}, AT_SYMLINK_NOFOLLOW) = 0
03:49:29 newfstatat(AT_FDCWD, "/opt/oracle/diag/rdbms/free/FREE/trace/FREE_ora_676.trc", {st_mode=S_IFREG|0640, st_size=0, ...}, 0) = 0
03:49:29 fcntl(4, F_SETFD, FD_CLOEXEC)  = 0
03:49:29 --- SIGILL {si_signo=SIGILL, si_code=ILL_ILLOPC, si_addr=0xeb532fc} ---
03:49:29 rt_sigprocmask(SIG_BLOCK, [ALRM], NULL, 8) = 0
03:49:29 rt_sigprocmask(SIG_UNBLOCK, [ILL], NULL, 8) = 0
03:49:29 newfstatat(AT_FDCWD, "/opt/oracle/diag/rdbms/free/FREE/trace/FREE_ora_676.trc", {st_mode=S_IFREG|0640, st_size=0, ...}, AT_SYMLINK_NOFOLLOW) = 0
03:49:29 openat(AT_FDCWD, "/opt/oracle/diag/rdbms/free/FREE/trace/FREE_ora_676.trc", O_WRONLY|O_CREAT|O_APPEND, 0660) = 11
03:49:29 newfstatat(AT_FDCWD, "/opt/oracle/diag/rdbms/free/FREE/trace/FREE_ora_676.trc", {st_mode=S_IFREG|0640, st_size=0, ...}, AT_SYMLINK_NOFOLLOW) = 0
03:49:29 newfstatat(AT_FDCWD, "/opt/oracle/diag/rdbms/free/FREE/trace/FREE_ora_676.trc", {st_mode=S_IFREG|0640, st_size=0, ...}, 0) = 0
03:49:29 fcntl(11, F_SETFD, FD_CLOEXEC) = 0
03:49:29 --- SIGILL {si_signo=SIGILL, si_code=ILL_ILLOPC, si_addr=0xeb532fc} ---
03:49:29 rt_sigprocmask(SIG_BLOCK, [ALRM], NULL, 8) = 0
03:49:29 rt_sigprocmask(SIG_UNBLOCK, [ILL], NULL, 8) = 0
03:49:29 newfstatat(AT_FDCWD, "/opt/oracle/diag/rdbms/free/FREE/trace/FREE_ora_676.trc", {st_mode=S_IFREG|0640, st_size=0, ...}, AT_SYMLINK_NOFOLLOW) = 0
03:49:29 openat(AT_FDCWD, "/opt/oracle/diag/rdbms/free/FREE/trace/FREE_ora_676.trc", O_WRONLY|O_CREAT|O_APPEND, 0660) = 13
03:49:29 newfstatat(AT_FDCWD, "/opt/oracle/diag/rdbms/free/FREE/trace/FREE_ora_676.trc", {st_mode=S_IFREG|0640, st_size=0, ...}, AT_SYMLINK_NOFOLLOW) = 0
03:49:29 newfstatat(AT_FDCWD, "/opt/oracle/diag/rdbms/free/FREE/trace/FREE_ora_676.trc", {st_mode=S_IFREG|0640, st_size=0, ...}, 0) = 0
03:49:29 fcntl(13, F_SETFD, FD_CLOEXEC) = 0
03:49:29 --- SIGILL {si_signo=SIGILL, si_code=ILL_ILLOPC, si_addr=0xeb532fc} ---
03:49:29 rt_sigprocmask(SIG_BLOCK, [ALRM], NULL, 8) = 0
03:49:29 rt_sigprocmask(SIG_UNBLOCK, [ILL], NULL, 8) = 0
03:49:29 newfstatat(AT_FDCWD, "/opt/oracle/diag/rdbms/free/FREE/trace/FREE_ora_676.trc", {st_mode=S_IFREG|0640, st_size=0, ...}, AT_SYMLINK_NOFOLLOW) = 0
03:49:29 openat(AT_FDCWD, "/opt/oracle/diag/rdbms/free/FREE/trace/FREE_ora_676.trc", O_WRONLY|O_CREAT|O_APPEND, 0660) = 14
03:49:29 newfstatat(AT_FDCWD, "/opt/oracle/diag/rdbms/free/FREE/trace/FREE_ora_676.trc", {st_mode=S_IFREG|0640, st_size=0, ...}, AT_SYMLINK_NOFOLLOW) = 0
03:49:29 newfstatat(AT_FDCWD, "/opt/oracle/diag/rdbms/free/FREE/trace/FREE_ora_676.trc", {st_mode=S_IFREG|0640, st_size=0, ...}, 0) = 0
03:49:29 fcntl(14, F_SETFD, FD_CLOEXEC) = 0
03:49:29 --- SIGILL {si_signo=SIGILL, si_code=ILL_ILLOPC, si_addr=0xeb532fc} ---
03:49:29 rt_sigprocmask(SIG_BLOCK, [ALRM], NULL, 8) = 0
03:49:29 rt_sigprocmask(SIG_UNBLOCK, [ILL], NULL, 8) = 0
03:49:29 newfstatat(AT_FDCWD, "/opt/oracle/diag/rdbms/free/FREE/trace/FREE_ora_676.trc", {st_mode=S_IFREG|0640, st_size=0, ...}, AT_SYMLINK_NOFOLLOW) = 0
03:49:29 openat(AT_FDCWD, "/opt/oracle/diag/rdbms/free/FREE/trace/FREE_ora_676.trc", O_WRONLY|O_CREAT|O_APPEND, 0660) = 15
03:49:29 newfstatat(AT_FDCWD, "/opt/oracle/diag/rdbms/free/FREE/trace/FREE_ora_676.trc", {st_mode=S_IFREG|0640, st_size=0, ...}, AT_SYMLINK_NOFOLLOW) = 0
03:49:29 newfstatat(AT_FDCWD, "/opt/oracle/diag/rdbms/free/FREE/trace/FREE_ora_676.trc", {st_mode=S_IFREG|0640, st_size=0, ...}, 0) = 0
03:49:29 fcntl(15, F_SETFD, FD_CLOEXEC) = 0
03:49:29 --- SIGILL {si_signo=SIGILL, si_code=ILL_ILLOPC, si_addr=0xeb532fc} ---
03:49:29 rt_sigprocmask(SIG_BLOCK, [ALRM], NULL, 8) = 0
03:49:29 rt_sigprocmask(SIG_UNBLOCK, [ILL], NULL, 8) = 0
03:49:29 write(8, "ssexhd: failed 6 times to record"..., 85) = 85
03:49:29 write(8, "\n\n----- Call Stack Trace -----\n", 31) = 31
03:49:29 write(8, "calling              call     en"..., 80) = 80
03:49:29 write(8, "location             type     po"..., 80) = 80
03:49:29 write(8, "-------------------- -------- --"..., 80) = 80
03:49:29 readlinkat(AT_FDCWD, "/proc/self/exe", "/opt/oracle/product/23ai/dbhomeF"..., 513) = 46
We can also see some more interesting info from the strace output. Apparently, the software is telling us that something is going wrong:
03:49:29 write(8, "ssexhd: failed 6 times to record"..., 85) = 85
03:49:29 write(8, "\n\n----- Call Stack Trace -----\n", 31) = 31
03:49:29 write(8, "calling              call     en"..., 80) = 80
03:49:29 write(8, "location             type     po"..., 80) = 80
03:49:29 write(8, "-------------------- -------- --"..., 80) = 80
03:49:29 readlinkat(AT_FDCWD, "/proc/self/exe", "/opt/oracle/product/23ai/dbhomeF"..., 513) = 46
Let’s run strace one more time but this time have it not cut off the strings:
[oracle@3e8fb8b8ee97 trace]$ rm *
[oracle@3e8fb8b8ee97 trace]$ strace -fft -s 1000 -o oracle.strace sqlplus / as sysdba <<EOF
startup;
EOF


SQL*Plus: Release 23.0.0.0.0 - Production on Sun Sep 22 04:14:51 2024
Version 23.5.0.24.07

Copyright (c) 1982, 2024, Oracle.  All rights reserved.

Connected to an idle instance.

SQL> ORA-03113: end-of-file on communication channel
SQL> Disconnected
[oracle@3e8fb8b8ee97 trace]$ grep "\-\-\-" oracle.strace*
oracle.strace.813:04:14:52 --- SIGCHLD {si_signo=SIGCHLD, si_code=CLD_EXITED, si_pid=814, si_uid=54321, si_status=0, si_utime=64, si_stime=6} ---
oracle.strace.814:04:14:51 --- SIGILL {si_signo=SIGILL, si_code=ILL_ILLOPC, si_addr=0xeb532fc} ---
oracle.strace.814:04:14:51 --- SIGILL {si_signo=SIGILL, si_code=ILL_ILLOPC, si_addr=0xeb532fc} ---
oracle.strace.814:04:14:51 --- SIGILL {si_signo=SIGILL, si_code=ILL_ILLOPC, si_addr=0xeb532fc} ---
oracle.strace.814:04:14:51 --- SIGILL {si_signo=SIGILL, si_code=ILL_ILLOPC, si_addr=0xeb532fc} ---
oracle.strace.814:04:14:51 --- SIGILL {si_signo=SIGILL, si_code=ILL_ILLOPC, si_addr=0xeb532fc} ---
oracle.strace.814:04:14:51 --- SIGILL {si_signo=SIGILL, si_code=ILL_ILLOPC, si_addr=0xeb532fc} ---
oracle.strace.814:04:14:51 write(8, "\n\n----- Call Stack Trace -----\n", 31) = 31
oracle.strace.814:04:14:51 write(8, "-------------------- -------- -------------------- ----------------------------\n", 80) = 80
oracle.strace.814:04:14:52 write(8, "--------------------- Binary Stack Dump ---------------------\n", 62) = 62
oracle.strace.814:04:14:52 --- SIGSEGV {si_signo=SIGSEGV, si_code=SEGV_MAPERR, si_addr=0x3} ---
oracle.strace.814:04:14:52 --- SIGSEGV {si_signo=SIGSEGV, si_code=SEGV_MAPERR, si_addr=0x1} ---
oracle.strace.814:04:14:52 --- SIGCHLD {si_signo=SIGCHLD, si_code=CLD_DUMPED, si_pid=815, si_uid=54321, si_status=SIGABRT, si_utime=0, si_stime=5} ---
oracle.strace.815:04:14:52 --- SIGABRT {si_signo=SIGABRT, si_code=SI_TKILL, si_pid=815, si_uid=54321} ---
Checking the particular section of the trace file we can see now:
04:14:51 write(8, "ssexhd: failed 6 times to record signal=4, get stack trace then crash the process...\n", 85) = 85
04:14:51 write(8, "\n\n----- Call Stack Trace -----\n", 31) = 31
04:14:51 write(8, "calling              call     entry                argument values in hex      \n", 80) = 80
04:14:51 write(8, "location             type     point                (? means dubious value)     \n", 80) = 80
04:14:51 write(8, "-------------------- -------- -------------------- ----------------------------\n", 80) = 80
04:14:51 readlinkat(AT_FDCWD, "/proc/self/exe", "/opt/oracle/product/23ai/dbhomeFree/bin/oracle", 513) = 46
From the output, we can see that the program crashed deliberately because it failed 6 times to record signal=4, whatever signal=4 is. Let’s have a look at whether the same is true for the Listener:
[oracle@3e8fb8b8ee97 trace]$ strace -fft -s 1000 -o listener.strace lsnrctl start

LSNRCTL for Linux: Version 23.0.0.0.0 - Production on 22-SEP-2024 21:18:51

Copyright (c) 1991, 2024, Oracle.  All rights reserved.

Starting /opt/oracle/product/23ai/dbhomeFree/bin/tnslsnr: please wait...

TNS-12547: TNS:lost contact
 TNS-12560: Database communication protocol error.
  TNS-00517: Lost contact
   Linux Error: 32: Broken pipe
[oracle@3e8fb8b8ee97 trace]$ grep "\-\-\-" listener.strace*
listener.strace.4920:21:18:51 --- SIGCHLD {si_signo=SIGCHLD, si_code=CLD_EXITED, si_pid=4921, si_uid=54321, si_status=0, si_utime=0, si_stime=0} ---
listener.strace.4922:21:18:51 --- SIGILL {si_signo=SIGILL, si_code=ILL_ILLOPC, si_addr=0x7fac6e473c} ---
Also here we can find a SIGILL as being the cause of the crash when trying to read the /opt/oracle/product/23ai/dbhomeFree/network/admin/sqlnet.ora file.
21:18:51 openat(AT_FDCWD, "/opt/oracle/product/23ai/dbhomeFree/network/admin/sqlnet.ora", O_RDONLY) = 5
21:18:51 fcntl(5, F_SETFD, FD_CLOEXEC)  = 0
21:18:51 fstat(5, {st_mode=S_IFREG|0644, st_size=138, ...}) = 0
21:18:51 brk(NULL)                      = 0x1d44a000
21:18:51 brk(0x1d46b000)                = 0x1d46b000
21:18:51 read(5, "NAMES.DIRECTORY_PATH = (EZCONNECT, TNSNAMES)\n# See https://github.com/gvenzl/oci-oracle-xe/issues/43\nDISABLE_OOB=ON\nBREAK_POLL_SKIP=1000\n\n", 4096) = 138
21:18:51 read(5, "", 4096)              = 0
21:18:51 close(5)                       = 0
21:18:51 brk(NULL)                      = 0x1d46b000
21:18:51 brk(NULL)                      = 0x1d46b000
21:18:51 brk(0x1d46a000)                = 0x1d46a000
21:18:51 brk(NULL)                      = 0x1d46a000
21:18:51 brk(NULL)                      = 0x1d46a000
21:18:51 brk(NULL)                      = 0x1d46a000
21:18:51 brk(0x1d468000)                = 0x1d468000
21:18:51 brk(NULL)                      = 0x1d468000
21:18:51 newfstatat(AT_FDCWD, "/opt/oracle/diag", {st_mode=S_IFDIR|0775, st_size=4096, ...}, 0) = 0
21:18:51 geteuid()                      = 54321
21:18:51 newfstatat(AT_FDCWD, "/opt/oracle/diag/tnslsnr", {st_mode=S_IFDIR|0775, st_size=4096, ...}, 0) = 0
21:18:51 geteuid()                      = 54321
21:18:51 newfstatat(AT_FDCWD, "/opt/oracle/diag/tnslsnr/3e8fb8b8ee97", {st_mode=S_IFDIR|0755, st_size=4096, ...}, 0) = 0
21:18:51 geteuid()                      = 54321
21:18:51 newfstatat(AT_FDCWD, "/opt/oracle/diag/tnslsnr/3e8fb8b8ee97/listener", {st_mode=S_IFDIR|0755, st_size=4096, ...}, 0) = 0
21:18:51 geteuid()                      = 54321
21:18:51 newfstatat(AT_FDCWD, "/opt/oracle/diag/tnslsnr/3e8fb8b8ee97/listener", {st_mode=S_IFDIR|0755, st_size=4096, ...}, 0) = 0
21:18:51 newfstatat(AT_FDCWD, "/opt/oracle/diag/tnslsnr/3e8fb8b8ee97/listener/trace", {st_mode=S_IFDIR|0755, st_size=4096, ...}, 0) = 0
21:18:51 geteuid()                      = 54321
21:18:51 newfstatat(AT_FDCWD, "/opt/oracle/diag/tnslsnr/3e8fb8b8ee97/listener/alert", {st_mode=S_IFDIR|0755, st_size=4096, ...}, 0) = 0
21:18:51 geteuid()                      = 54321
21:18:51 newfstatat(AT_FDCWD, "/opt/oracle/diag/tnslsnr/3e8fb8b8ee97/listener/incident", {st_mode=S_IFDIR|0755, st_size=4096, ...}, 0) = 0
21:18:51 geteuid()                      = 54321
21:18:51 newfstatat(AT_FDCWD, "/opt/oracle/diag/tnslsnr/3e8fb8b8ee97/listener/metadata", {st_mode=S_IFDIR|0755, st_size=4096, ...}, 0) = 0
21:18:51 geteuid()                      = 54321
21:18:51 newfstatat(AT_FDCWD, "/opt/oracle/diag/tnslsnr/3e8fb8b8ee97/listener/metadata_pv", {st_mode=S_IFDIR|0755, st_size=4096, ...}, 0) = 0
21:18:51 geteuid()                      = 54321
21:18:51 newfstatat(AT_FDCWD, "/opt/oracle/diag/tnslsnr/3e8fb8b8ee97/listener/metadata_dgif", {st_mode=S_IFDIR|0755, st_size=4096, ...}, 0) = 0
21:18:51 geteuid()                      = 54321
21:18:51 newfstatat(AT_FDCWD, "/opt/oracle/diag/tnslsnr/3e8fb8b8ee97/listener/incpkg", {st_mode=S_IFDIR|0755, st_size=4096, ...}, 0) = 0
21:18:51 geteuid()                      = 54321
21:18:51 newfstatat(AT_FDCWD, "/opt/oracle/diag/tnslsnr/3e8fb8b8ee97/listener/sweep", {st_mode=S_IFDIR|0755, st_size=4096, ...}, 0) = 0
21:18:51 geteuid()                      = 54321
21:18:51 newfstatat(AT_FDCWD, "/opt/oracle/diag/tnslsnr/3e8fb8b8ee97/listener/lck", {st_mode=S_IFDIR|0755, st_size=4096, ...}, 0) = 0
21:18:51 geteuid()                      = 54321
21:18:51 newfstatat(AT_FDCWD, "/opt/oracle/diag/tnslsnr/3e8fb8b8ee97/listener/cdump", {st_mode=S_IFDIR|0755, st_size=4096, ...}, 0) = 0
21:18:51 geteuid()                      = 54321
21:18:51 newfstatat(AT_FDCWD, "/opt/oracle/diag/tnslsnr/3e8fb8b8ee97/listener/stage", {st_mode=S_IFDIR|0755, st_size=4096, ...}, 0) = 0
21:18:51 geteuid()                      = 54321
21:18:51 newfstatat(AT_FDCWD, "/opt/oracle/diag/tnslsnr/3e8fb8b8ee97/listener/metadata", {st_mode=S_IFDIR|0755, st_size=4096, ...}, 0) = 0
21:18:51 geteuid()                      = 54321
21:18:51 newfstatat(AT_FDCWD, "/opt/oracle/diag/tnslsnr/3e8fb8b8ee97/listener/log", {st_mode=S_IFDIR|0755, st_size=4096, ...}, 0) = 0
21:18:51 geteuid()                      = 54321
21:18:51 newfstatat(AT_FDCWD, "/opt/oracle/diag/tnslsnr/3e8fb8b8ee97/listener/log/debug", {st_mode=S_IFDIR|0755, st_size=4096, ...}, 0) = 0
21:18:51 geteuid()                      = 54321
21:18:51 newfstatat(AT_FDCWD, "/opt/oracle/diag/tnslsnr/3e8fb8b8ee97/listener/log/test", {st_mode=S_IFDIR|0755, st_size=4096, ...}, 0) = 0
21:18:51 geteuid()                      = 54321
21:18:51 newfstatat(AT_FDCWD, "/opt/oracle/diag/tnslsnr/3e8fb8b8ee97/listener/metadata/ADR_CONTROL.ams", 0x7fd5cc6a40, AT_SYMLINK_NOFOLLOW) = -1 ENOENT (No such file or directory)
21:18:51 newfstatat(AT_FDCWD, "/opt/oracle/diag/tnslsnr/3e8fb8b8ee97/listener/metadata/ADR_CONTROL.ams", 0x7fd5cc6b10, 0) = -1 ENOENT (No such file or directory)
21:18:51 mmap(NULL, 12288, PROT_READ|PROT_WRITE, MAP_PRIVATE|MAP_ANONYMOUS|MAP_NORESERVE, -1, 0) = 0x7fa922d000
21:18:51 mmap(0x7fa922d000, 12288, PROT_READ|PROT_WRITE, MAP_PRIVATE|MAP_FIXED|MAP_ANONYMOUS, -1, 0) = 0x7fa922d000
21:18:51 mmap(NULL, 12288, PROT_READ|PROT_WRITE, MAP_PRIVATE|MAP_ANONYMOUS|MAP_NORESERVE, -1, 0) = 0x7fa922a000
21:18:51 mmap(0x7fa922a000, 12288, PROT_READ|PROT_WRITE, MAP_PRIVATE|MAP_FIXED|MAP_ANONYMOUS, -1, 0) = 0x7fa922a000
21:18:51 openat(AT_FDCWD, "/opt/oracle/diag/tnslsnr/3e8fb8b8ee97/listener/lck/AM_3216668543_3129272988.lck", O_RDWR|O_CREAT, 0660) = 5
21:18:51 newfstatat(AT_FDCWD, "/opt/oracle/diag/tnslsnr/3e8fb8b8ee97/listener/lck/AM_3216668543_3129272988.lck", {st_mode=S_IFREG|0640, st_size=0, ...}, 0) = 0
21:18:51 fcntl(5, F_GETFL)              = 0x20002 (flags O_RDWR|O_LARGEFILE)
21:18:51 fcntl(5, F_SETLK, {l_type=F_WRLCK, l_whence=SEEK_SET, l_start=0, l_len=0}) = 0
21:18:51 --- SIGILL {si_signo=SIGILL, si_code=ILL_ILLOPC, si_addr=0x7fac6e473c} ---
21:18:53 +++ killed by SIGILL (core dumped) +++
But, even more interesting, here the program crashes because of SIGILL, not because it terminates itself, see the last line +++ killed by SIGILL (core dumped) +++. Now we have a core dump that we can use to take a closer look as to what instruction caused the SIGILL.
Core dump investigation
A crashed program usually generates a core dump file (unless that’s disabled) which can be further investigated to see where the program crashed. Indeed, looking at the current working directory, we can find a core file from the tnslsnr program:
[oracle@3e8fb8b8ee97 trace]$ ls -al
total 59392
drwxr-x---  2 oracle oinstall     4096 Sep 22 21:18 .
drwxr-x--- 16 oracle oinstall     4096 Sep 21 19:22 ..
-rw-------  1 oracle oinstall 61132800 Sep 22 21:18 core
-rw-r--r--  1 oracle oinstall    94122 Sep 22 21:18 listener.strace.4920
-rw-r--r--  1 oracle oinstall      244 Sep 22 21:18 listener.strace.4921
-rw-r--r--  1 oracle oinstall    75080 Sep 22 21:18 listener.strace.4922
This core dump file can now be loaded into gdb which will tell us where the program died:
[oracle@3e8fb8b8ee97 trace]$ gdb $ORACLE_HOME/bin/tnslsnr core
GNU gdb (GDB) Red Hat Enterprise Linux 8.2-20.0.2.el8
Copyright (C) 2018 Free Software Foundation, Inc.
License GPLv3+: GNU GPL version 3 or later <http://gnu.org/licenses/gpl.html>
This is free software: you are free to change and redistribute it.
There is NO WARRANTY, to the extent permitted by law.
Type "show copying" and "show warranty" for details.
This GDB was configured as "aarch64-redhat-linux-gnu".
Type "show configuration" for configuration details.
For bug reporting instructions, please see:
<http://www.gnu.org/software/gdb/bugs/>.
Find the GDB manual and other documentation resources online at:
    <http://www.gnu.org/software/gdb/documentation/>.

For help, type "help".
Type "apropos word" to search for commands related to "word"...
Reading symbols from /opt/oracle/product/23ai/dbhomeFree/bin/tnslsnr...(no debugging symbols found)...done.
[New LWP 4922]
[Thread debugging using libthread_db enabled]
Using host libthread_db library "/lib64/libthread_db.so.1".
Core was generated by `/opt/oracle/product/23ai/dbhomeFree/bin/tnslsnr LISTENER -inherit'.
Program terminated with signal SIGILL, Illegal instruction.
#0  0x0000007fac6e473c in dbgrfafr_add_fileref () from /opt/oracle/product/23ai/dbhomeFree/lib/libclntsh.so.23.1
Missing separate debuginfos, use: yum debuginfo-install oracle-database-free-23ai-1.0-1.aarch64
If we go to the assembly instructions for dbgrfafr_add_fileref(), we can find out what instruction (opcode) was illegal:
(gdb) disassemble
Dump of assembler code for function dbgrfafr_add_fileref:
   0x0000007fac6e46b4 <+0>:	sub	sp, sp, #0x90
   0x0000007fac6e46b8 <+4>:	stp	x29, x30, [sp, #32]
   0x0000007fac6e46bc <+8>:	add	x29, sp, #0x20
   0x0000007fac6e46c0 <+12>:	stp	x19, x20, [sp, #48]
   0x0000007fac6e46c4 <+16>:	stp	x21, x22, [sp, #64]
   0x0000007fac6e46c8 <+20>:	mov	w21, w1
   0x0000007fac6e46cc <+24>:	stp	x23, x24, [sp, #80]
   0x0000007fac6e46d0 <+28>:	mov	x23, x0
   0x0000007fac6e46d4 <+32>:	mov	x24, x3
   0x0000007fac6e46d8 <+36>:	stp	x25, x26, [sp, #96]
   0x0000007fac6e46dc <+40>:	str	x0, [sp, #112]
   0x0000007fac6e46e0 <+44>:	str	x1, [sp, #120]
   0x0000007fac6e46e4 <+48>:	str	x2, [sp, #128]
   0x0000007fac6e46e8 <+52>:	str	x3, [sp, #136]
   0x0000007fac6e46ec <+56>:	ldr	x19, [x0, #64]
   0x0000007fac6e46f0 <+60>:	mov	x25, x19
   0x0000007fac6e46f4 <+64>:	cbz	x19, 0x7fac6e47d0 <dbgrfafr_add_fileref+284>
   0x0000007fac6e46f8 <+68>:	ldr	w0, [x19]
   0x0000007fac6e46fc <+72>:	tbz	w0, #0, 0x7fac6e47d0 <dbgrfafr_add_fileref+284>
   0x0000007fac6e4700 <+76>:	tbnz	w0, #8, 0x7fac6e47d0 <dbgrfafr_add_fileref+284>
   0x0000007fac6e4704 <+80>:	ldr	w22, [x19, #1720]
   0x0000007fac6e4708 <+84>:	mov	w7, w22
   0x0000007fac6e470c <+88>:	cmp	w22, #0x3b
   0x0000007fac6e4710 <+92>:	b.hi	0x7fac6e4a40 <dbgrfafr_add_fileref+908>  // b.pmore
   0x0000007fac6e4714 <+96>:	add	x20, x19, x7, lsl #4
   0x0000007fac6e4718 <+100>:	add	x4, x7, #0x6c
   0x0000007fac6e471c <+104>:	lsl	x1, x4, #4
   0x0000007fac6e4720 <+108>:	add	x4, x19, x4, lsl #4
   0x0000007fac6e4724 <+112>:	ldr	x0, [x20, #1728]
   0x0000007fac6e4728 <+116>:	tbnz	w0, #0, 0x7fac6e4848 <dbgrfafr_add_fileref+404>
   0x0000007fac6e472c <+120>:	ldr	x0, [x19, x1]
   0x0000007fac6e4730 <+124>:	tbnz	w0, #4, 0x7fac6e4848 <dbgrfafr_add_fileref+404>
   0x0000007fac6e4734 <+128>:	orr	x3, x0, #0x10
   0x0000007fac6e4738 <+132>:	mov	x1, x0
=> 0x0000007fac6e473c <+136>:	casal	x1, x3, [x4]
   0x0000007fac6e4740 <+140>:	cmp	x1, x0
   0x0000007fac6e4744 <+144>:	b.ne	0x7fac6e4844 <dbgrfafr_add_fileref+400>  // b.any
   0x0000007fac6e4748 <+148>:	ldr	x0, [x20, #1728]
   0x0000007fac6e474c <+152>:	tbnz	w0, #0, 0x7fac6e483c <dbgrfafr_add_fileref+392>
The => shows where the program terminated (by receiving a SIGILL, ILL_ILLOPC). It happens to be the casal assembly instruction. Looking at the ARM Compiler User Guide, we can determine that the casal instruction was introduced in ARMv8.1:
CASA, CASAL, CAS, CASL, CASAL, CAS, CASL
Compare and Swap word or doubleword in memory.
Syntax
CASA Ws, Wt, [Xn|SP{,#0}] ; 32-bit, acquire general registers
CASAL Ws, Wt, [Xn|SP{,#0}] ; 32-bit, acquire and release general registers
CAS Ws, Wt, [Xn|SP{,#0}] ; 32-bit, no memory ordering general registers
CASL Ws, Wt, [Xn|SP{,#0}] ; 32-bit, release general registers
CASA Xs, Xt, [Xn|SP{,#0}] ; 64-bit, acquire general registers
CASAL Xs, Xt, [Xn|SP{,#0}] ; 64-bit, acquire and release general registers
CAS Xs, Xt, [Xn|SP{,#0}] ; 64-bit, no memory ordering general registers
CASL Xs, Xt, [Xn|SP{,#0}] ; 64-bit, release general registersWhere:
Ws
Is the 32-bit name of the general-purpose register to be compared and loaded.Wt
Is the 32-bit name of the general-purpose register to be conditionally stored.Xn|SP
Is the 64-bit name of the general-purpose base register or stack pointer.Xs
Is the 64-bit name of the general-purpose register to be compared and loaded.Xt
Is the 64-bit name of the general-purpose register to be conditionally stored.Architectures supported
Supported in ARMv8.1 and later.
ARM Compiler User Guide
So, let’s look at what the Raspberry Pi 4 supports:
[oracle@3e8fb8b8ee97 trace]$ head /proc/cpuinfo
processor	: 0
BogoMIPS	: 108.00
Features	: fp asimd evtstrm crc32 cpuid
CPU implementer	: 0x41
CPU architecture: 8
CPU variant	: 0x0
CPU part	: 0xd08
CPU revision	: 3

processor	: 1
Hm, that’s not a good sign, the CPU architecture is reported as 8, and the CPU variant as 0x0, i.e. 0, not 1. In comparison, a Raspberry Pi 5 reports the following (Armv8.4):
gvenzl@gvenzl-rbp-5:~$ head /proc/cpuinfo
processor	: 0
BogoMIPS	: 108.00
Features	: fp asimd evtstrm aes pmull sha1 sha2 crc32 atomics fphp asimdhp cpuid asimdrdm lrcpc dcpop asimddp
CPU implementer	: 0x41
CPU architecture: 8
CPU variant	: 0x4
CPU part	: 0xd0b
CPU revision	: 1

processor	: 1
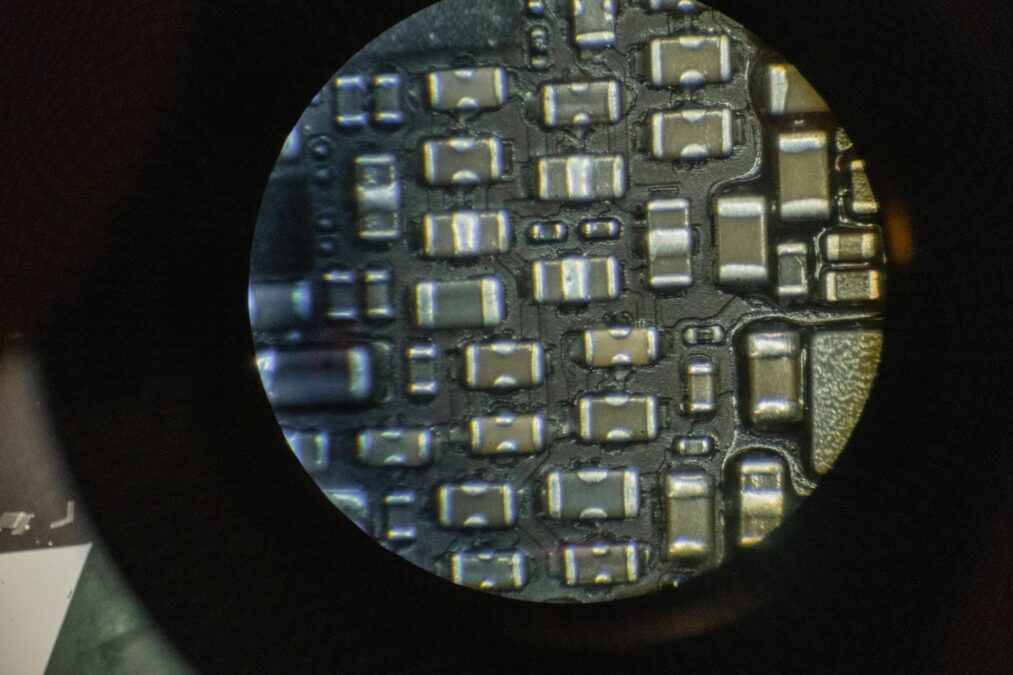
Let’s confirm this by looking at the specification. The Raspberry Pi 4 Model Specification states that it comes with the following chip: Broadcom BCM2711, Quad-core Cortex-A72 (ARM v8) 64-bit SoC @ 1.8GHz. On the ARM website, it states that the Cortex-A72 uses the Armv8-A architecture, but there is no sign of an ARMv8.1 anywhere:

And Wikipedia confirms that:
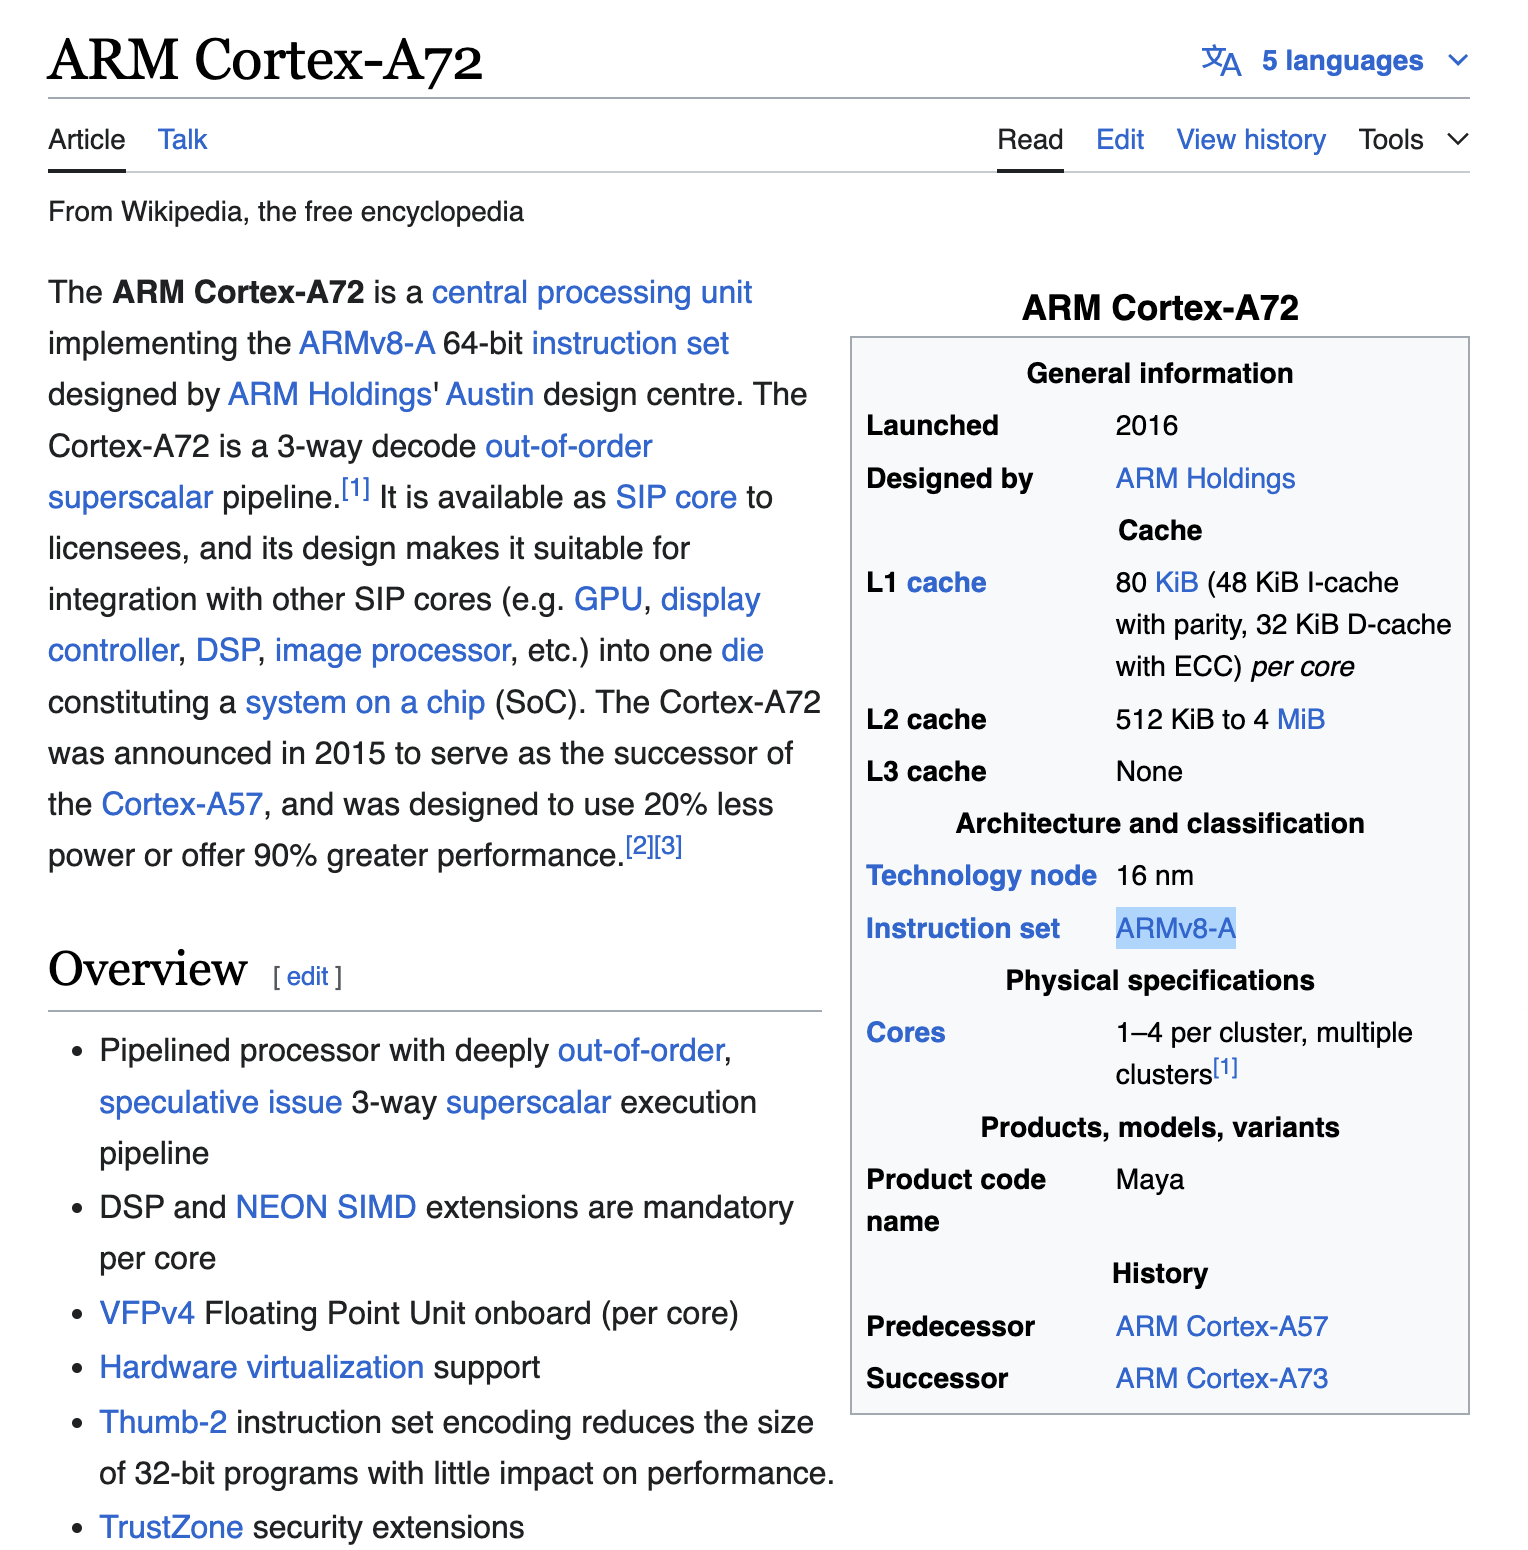
So we finally have our answer: the chip on the Raspberry Pi 4 does not yet support the instructions that Oracle Database Free issues.
Recap
To recap, the Oracle Database processes crash on startup due to a SIGILL, ILL_ILLOPC or, in other words, an illegal opcode or instruction being executed. We saw that the operation that failed was a filesystem operation. When starting up the Oracle Database, it failed trying to set the close-on-exec flag for a trace file file descriptor:
03:49:29 openat(AT_FDCWD, "/opt/oracle/diag/rdbms/free/FREE/trace/FREE_ora_676.trc", O_WRONLY|O_CREAT|O_APPEND, 0660) = 11
03:49:29 newfstatat(AT_FDCWD, "/opt/oracle/diag/rdbms/free/FREE/trace/FREE_ora_676.trc", {st_mode=S_IFREG|0640, st_size=0, ...}, AT_SYMLINK_NOFOLLOW) = 0
03:49:29 newfstatat(AT_FDCWD, "/opt/oracle/diag/rdbms/free/FREE/trace/FREE_ora_676.trc", {st_mode=S_IFREG|0640, st_size=0, ...}, 0) = 0
03:49:29 fcntl(11, F_SETFD, FD_CLOEXEC) = 0
03:49:29 --- SIGILL {si_signo=SIGILL, si_code=ILL_ILLOPC, si_addr=0xeb532fc} ---
The fcntl() function is invoked on file descriptor 11 (provided by the openat() function) to set file descriptor flags (F_SETFD) to the value FD_CLOEXEC (close-on-exec flag).
For the Listener, the operation that failed was trying to get a write lock on the sqlnet.ora file:
21:18:51 openat(AT_FDCWD, "/opt/oracle/product/23ai/dbhomeFree/network/admin/sqlnet.ora", O_RDONLY) = 5
...
...
21:18:51 fcntl(5, F_SETLK, {l_type=F_WRLCK, l_whence=SEEK_SET, l_start=0, l_len=0}) = 0
21:18:51 --- SIGILL {si_signo=SIGILL, si_code=ILL_ILLOPC, si_addr=0x7fac6e473c} ---
21:18:53 +++ killed by SIGILL (core dumped) +++
The fcntl() function is invoked on file descriptor 5 (provided by the openat() function) to acquire a record lock (F_SETLK) of type write lock (F_WRLCK).
By looking into the core dump file for the Listener, we could determine that the assembly instruction that failed was casal, which is only supported for ARM8.1 onwards. In turn, the chip on a Raspberry Pi 4, a Cortex-A72, only supports ARMv8, and hence, the chip is simply too old to run Oracle Database Free.
What chip is Oracle Database Free compiled for?
Many of you will know that the compiler-generated instructions depend on what the compiler was told to compile for. Clearly, Oracle Database Free has not been compiled for a Cortex-A72 chip, but what chip has it been compiled for? A look at the binary’s gcc command line options reveal the following:
[oracle@3e8fb8b8ee97 trace]$ readelf -p .GCC.command.line $ORACLE_HOME/bin/tnslsnr

String dump of section '.GCC.command.line':
  [     0]  GNU C99 12.2.1 20221121 (Red Hat 12.2.1-7.4.0.4) -mcpu=neoverse-n1 -mpreserve-args -mlittle-endian -mabi=lp64 -O3 -trigraphs -std=gnu99 -ffp-contract=off -fno-schedule-insns -fno-ipa-cp-clone -fno-lifetime-dse -fstack-reuse=none -fno-omit-frame-pointer -fno-strict-aliasing -fno-shrink-wrap -fcommon -flive-patching=inline-only-static -fpatchable-function-entry=4,4 -fPIC -fprofile-use -fprofile-correction
The important bit here is -mcpu=neoverse-n1 which shows that the compiler was instructed to compile the code for the Neoverse N1 chip, which also uses the ARMv8-A architecture but with several extensions, including ARMv8.1 (which provides the casal assembly instruction) and more:
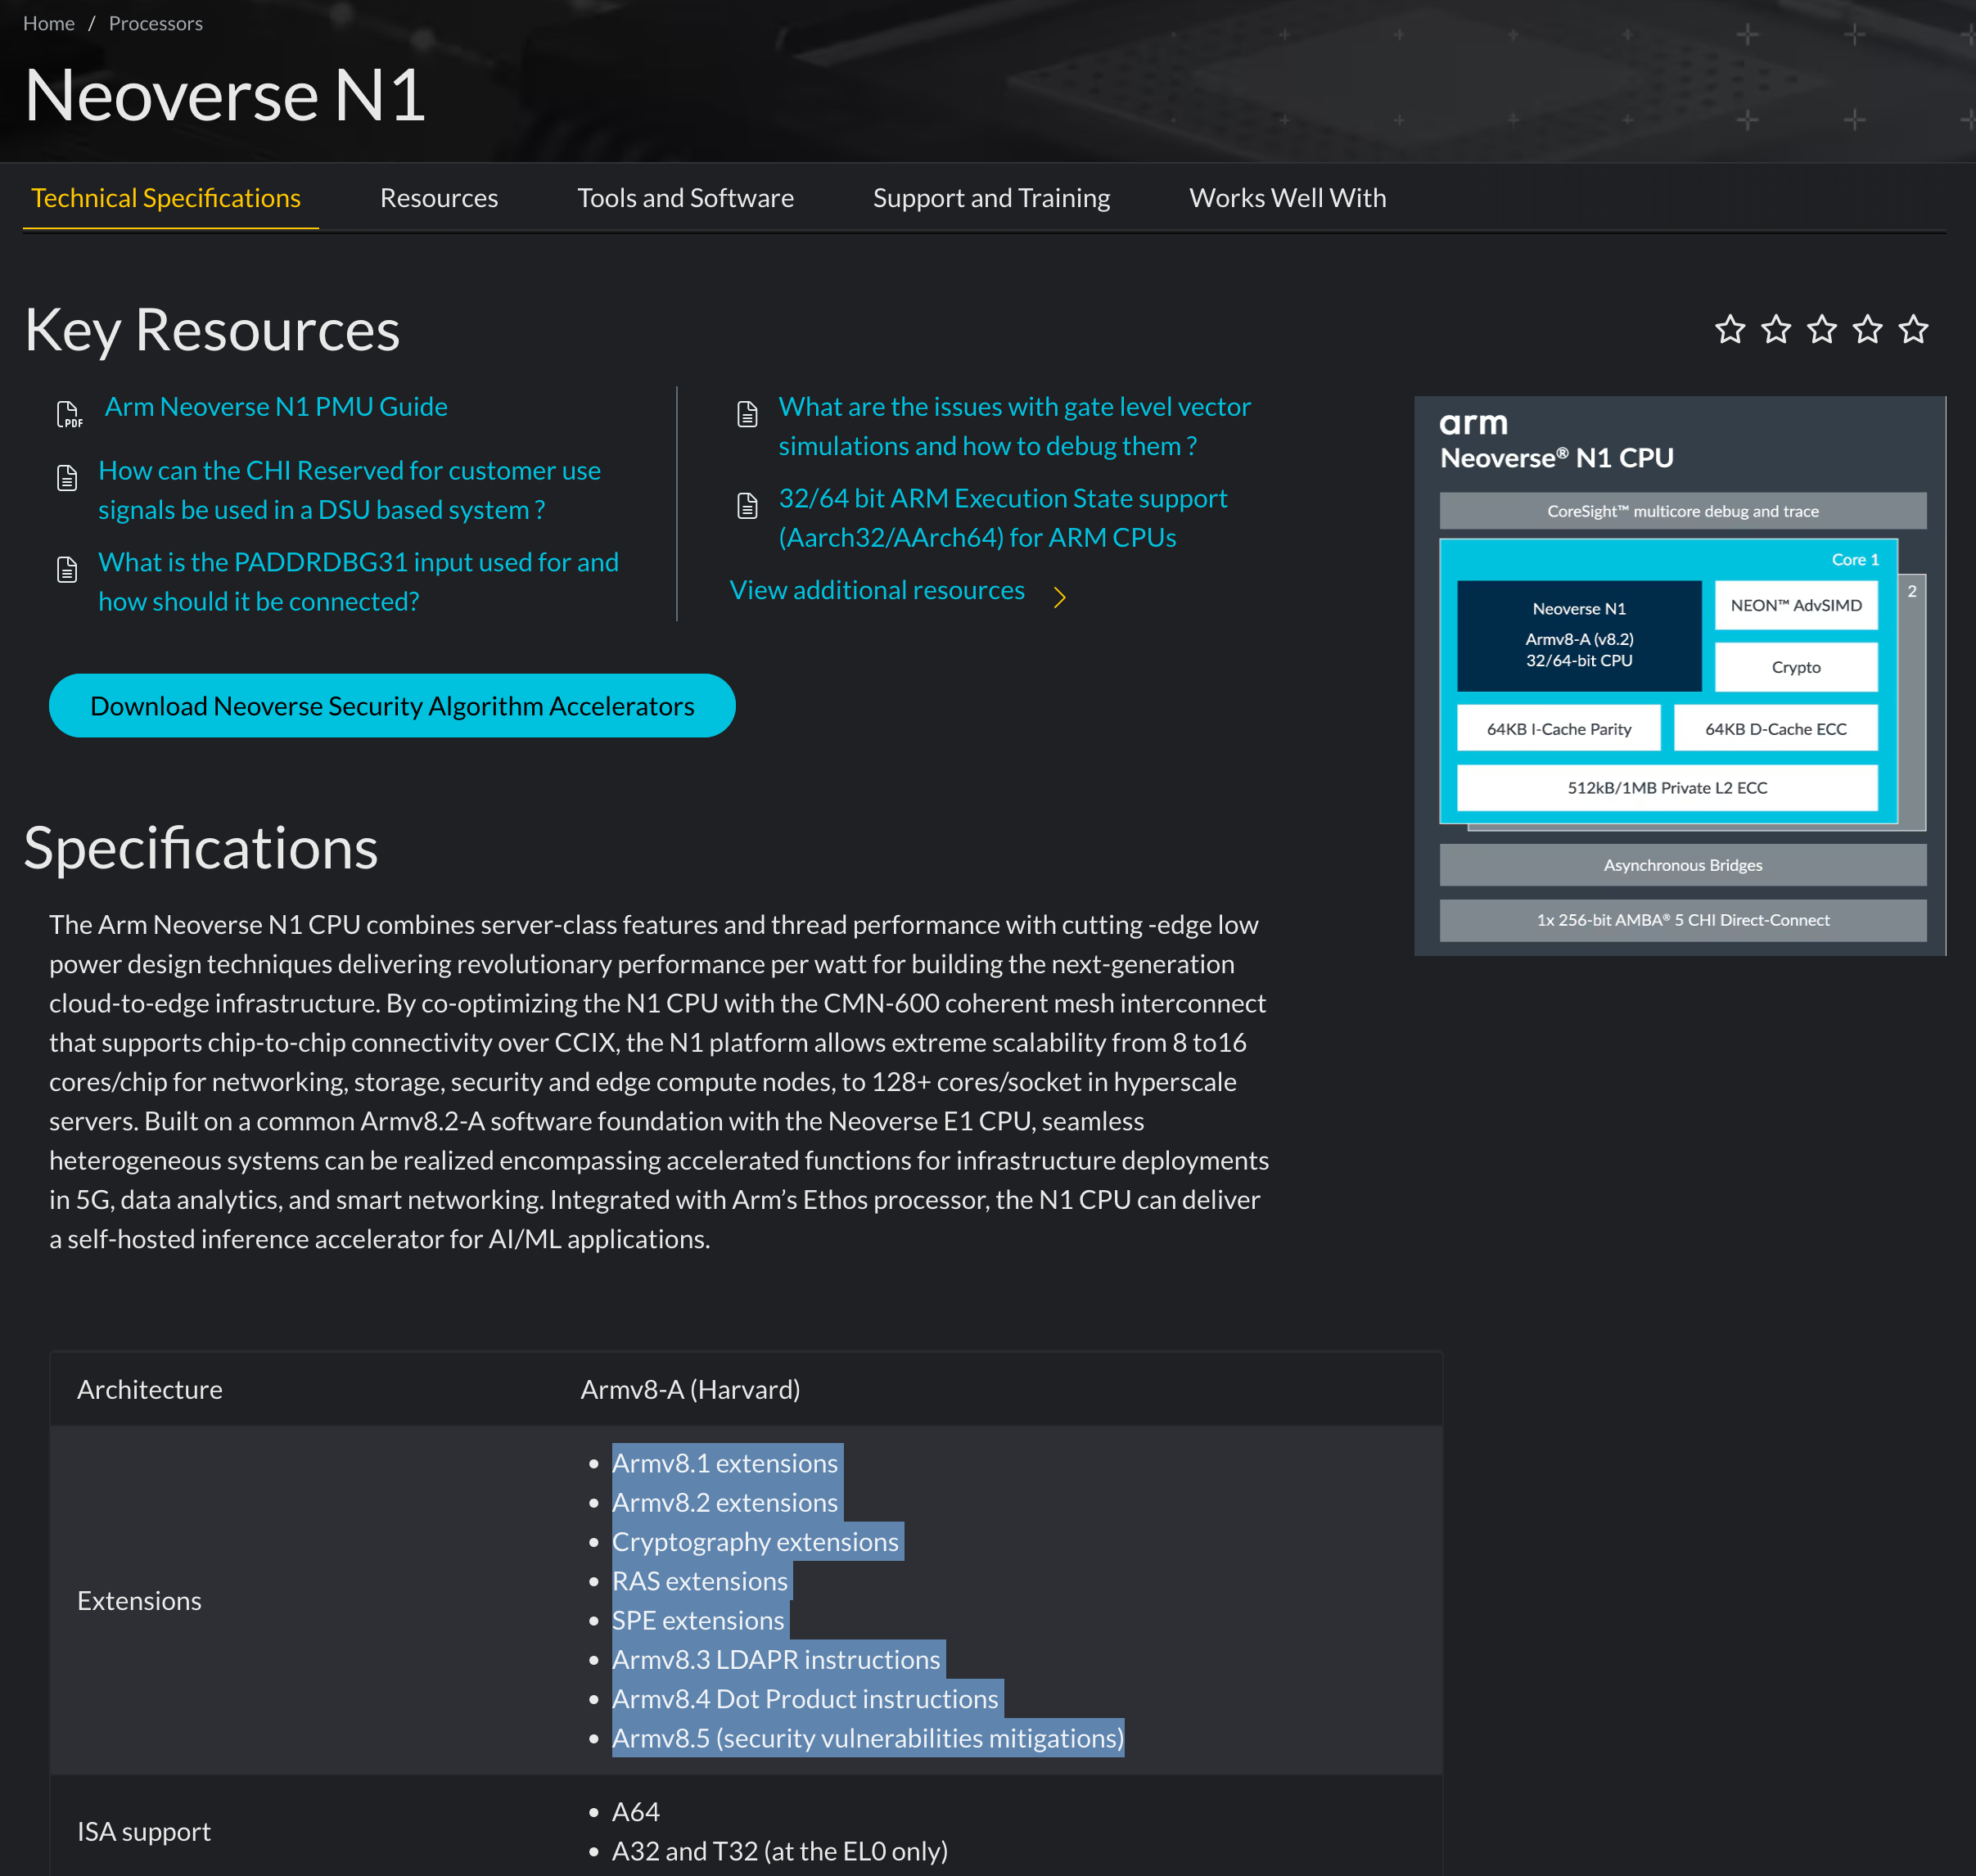
When I asked Development what the issue here is, they put it in much simpler terms. The code leverages atomic operations, which were introduced in ARMv8.1. Atomic operations allow a requester to modify data in a particular region of memory, while ensuring that writes from other requestors do not corrupt the data.
Atomic operations
To support the atomic instructions added in the Armv8.1 architecture, CHI-B provides Atomic Transactions. An interconnect uses Atomic Transactions to transport an atomic operation and its operands from one device to another. Using atomics instead of exclusive access reduces the amount of time during which data is inaccessible to other agents.
Atomic Transactions can execute several atomic operations and can be performed internally or externally to the processor.
This section introduces the basic concepts of Atomic Transactions. A future guide will contain more detailed information about atomics.
An atomic operation is a read-modify-write sequence that is performed without interference from another requester. Like exclusive accesses in AXI, Atomic Transactions allow a requester to modify data in a particular region of memory, while ensuring that writes from other requestors do not corrupt the data.
In AXI3 and 4 and CHI-A, a requester fetches the data, performs the operation, and then writes the result back for the atomic access to complete. CHI-B contains the option to transport the atomic operation to the interconnect, which allows the operation to perform closer to where the data resides. This increases efficiency and reduces the time that data is made inaccessible to other requesters.
To perform the atomic operation, the target needs an arithmetic logic unit (ALU). That is, to use atomic operations an HN, SN or both need an ALU. Atomic Transactions support is optional from CHI-B, so HNs and SNs do not always have to have an ALU. The requester has a configuration pin, BROADCASTATOMIC, that can be used to stop the requester from generating Atomic Transactions if the downstream system does not support them.
The full Atomic Transaction structure is:
ARM – Learn the architecture – Introducing AMBA CHI user guide
- The requester issues an Atomic Transaction to the interconnect
- The HN or SN has an ALU, so it performs the atomic operation
- Depending on the operation, the interconnect may return the original data of the address to the requester
So, in a nutshell, your chip needs to support these atomic operations, which you can quickly verify by looking once again at /proc/cpuinfo, looking for the atomics keyword.
On a Raspberry Pi 5, you see the following (note the atomics keyword):
gvenzl@gvenzl-rbp-5:~$ grep -i features /proc/cpuinfo
Features	: fp asimd evtstrm aes pmull sha1 sha2 crc32 atomics fphp asimdhp cpuid asimdrdm lrcpc dcpop asimddp
Features	: fp asimd evtstrm aes pmull sha1 sha2 crc32 atomics fphp asimdhp cpuid asimdrdm lrcpc dcpop asimddp
Features	: fp asimd evtstrm aes pmull sha1 sha2 crc32 atomics fphp asimdhp cpuid asimdrdm lrcpc dcpop asimddp
Features	: fp asimd evtstrm aes pmull sha1 sha2 crc32 atomics fphp asimdhp cpuid asimdrdm lrcpc dcpop asimddp
On a Raspberry Pi 4, you only see this:
gvenzl@gvenzl-rbp-4:~ $ grep -i features /proc/cpuinfo
Features	: fp asimd evtstrm crc32 cpuid
Features	: fp asimd evtstrm crc32 cpuid
Features	: fp asimd evtstrm crc32 cpuid
Features	: fp asimd evtstrm crc32 cpuid
As a side note, in the last couple of days, I have learned another interesting thing, namely that we all got way too comfortable with the set-in-stone x86_64 instruction set. I can barely remember when the age of an x86 CPU mattered as to whether it supported certain instructions. For ARM, the world looks a whole lot different. The Cortex-A72 is “only” from 2016, yet it runs an ARM architecture that doesn’t provide certain features of more modern chips.
By the way, the Raspberry Pi 5 runs a Cortex-A76 chip, which was released in 2018, only two years later.
I was struggling for a day with this. I was getting Listener configuration failed. Check log ‘/opt/oracle/cfgtoollogs/netca/netca_configure_out.log’ when I run /etc/init.d/oracle-free-23ai configure. I even once deinstalled the database software and reinstalled the software to run the configure command. Your post helped me to take a decision to not to continue with the installation. Thanks for your thorough investigation.